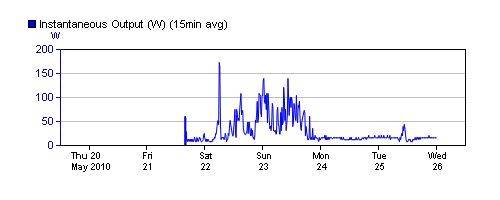


Does anyone else ever want to be able to scroll/pan the graphs back in time to see what it looked like yesterday, last week etc?
Or can this already be done and I'm too stupid to figure out how?
Right now what I am trying to find out is if it sounds realistic to say that the maximum 15-minute-average wind speed seen in Perth (Halls Head to be precise) since late Friday afternoon would have been about 14 knots. Sounds a bit too low, but I'm thinking perhaps the fact that I'm looking at 15-minute-average data may be averaging out the peaks a bit. Can anyone provide some insight?
Thanks!
You look quite shocked that I would ask such a thing Doggie (or is that shocked look always on your face?). Thanks heaps for the quick reply.
To get off topic a bit... it would appear that the wind turbine whose data I am looking at might be either not as efficient as the manufacturer claims, or is installed in a bit of a wind shadow. Has anyone ever compared the power output from a small wind turbine to actual wind readings to see if it matches what you'd expect based on manufacturer claims?